

Audit log files and Logfmt output for managed file transfers
SFTPPlus MFT writes filtered audit events to text, CSV, or Logfmt files and to standard output. Configure each log file for its own purpose, with separate paths, rotation, and retention settings.
- Updated
- 2026-10-21
SFTPPlus MFT records transfers, authentication, administration, and processing activity as structured audit events. Its event handlers can filter those events and write them to local files or standard output for log collection. Operations teams can keep a detailed audit trail and purpose-specific reports without splitting a single shared log after collection.
Create separate logs for separate purposes
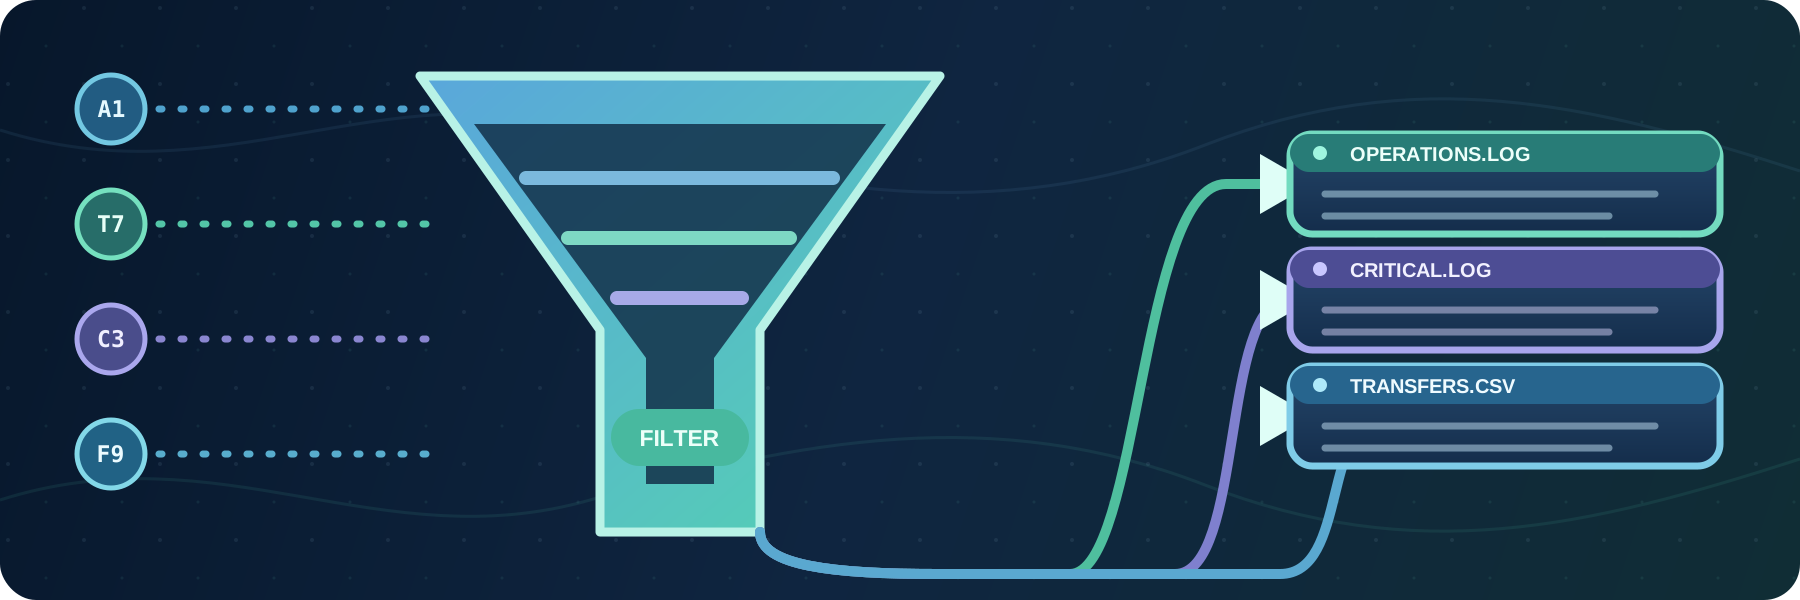
You can configure multiple log file event handlers. Each handler uses the full SFTPPlus event filtering rules, so every file can contain only the information needed by its audience.
For example, one installation can maintain:
- A complete operational log with all available details.
- A critical error log containing only events that require attention.
- A transfer report containing successful and failed file transfer summaries.
Each log has its own path, filters, format, rotation, and retention settings. This avoids making every team search through the same high-volume file. When comparing managed file transfer products, these independent settings are useful if audit, security, and reporting teams need different views of the same transfer activity.
Choose text, CSV, or Logfmt output
Text logs use a configurable format string. You can select event fields and arrange them in the order expected by existing operational tools.
Logfmt writes named event fields as key and value pairs for log collection and search tools. Both local file and standard output event handlers support it, and templates can include fields such as event severity and peer address. For a Docker or Kubernetes deployment, a standard output handler lets the platform's log collector capture events without reading a file inside the container.
For reporting and automated processing, SFTPPlus can write selected fields as CSV with a header row. This is useful when transfer records are imported into a reporting tool or processed by another application.
Log timestamps can use ISO 8601 UTC, ISO 8601 UTC with fractional seconds, or ISO 8601 with the server's local time and offset. Using one explicit format across all handlers makes events easier to correlate with remote systems.
Store and rotate files where needed
Each log can be written to a configured local path. The path can include the host name, which helps distinguish logs collected from several SFTPPlus instances.
SFTPPlus can rotate files when they reach a configured size, at a time each day, or on a selected day each month. Configure a retention count to limit how many rotated files remain and automatically remove older files.
Forward local logs to cloud monitoring
The files generated by SFTPPlus can be used as inputs for log collection agents. For example, the Amazon CloudWatch agent or Azure Monitor Agent can watch the configured paths and forward new entries to CloudWatch Logs or Azure Log Analytics.
SFTPPlus controls which events are written and how they are formatted. The collection agent then handles transport, aggregation, cloud retention, dashboards, and alerts.
You can also collect Prometheus process health metrics alongside these logs to monitor resource usage and application responsiveness. Transfer reports, including successful and failed file operations, come from the audit events recorded in the logs.
See the local log file event handler documentation for text, Logfmt, CSV, rotation, and retention options. The standard output event handler documentation covers logging to the process output.
Request a trial to test SFTPPlus MFT audit logging with your monitoring and reporting tools.